
The Average Cost-Per-Acquisition (CPA) is, arguably, the most important Key Performance Indicator (KPI) available to view on the Search Ads platform. CPAs can be very revealing of campaign performance and high CPAs are often reflective of inefficient campaigns.
Apple defines the Average CPA as, the total spend divided by the number of conversions received, within a given period. And, since Apple operate a ‘Cost-Per-Tap Model’, the Average CPA is affected by two metrics: the Average Cost-Per-Tap (CPT) and the Conversion Rate (CR). The Average CPT and CR are not independent metrics. The price a campaign pays for a tap is determined by your CPT Bid, the market and your app’s relevancy. Apple use Tap-Through-Rates (TTRs) and CRs as proxies for relevancy, and if the campaign is not deemed very relevant (e.g. low CR), chances are, the CPT will gradually become more expensive.
However, while you may have very little power over the CR of a keyword, you can exert some control over the CPT of a keyword.
The Basics: How the CR, CPT and CPA Relate
Although Apple defines Average CPA with regards to the spend and conversions generated, the Average CPA can be expressed in terms of the CR and the Average CPT. The Average CPA can be defined as the Average CPT divided by the CR; and therefore, by definition, fluctuations in the CPAs can reflect either variations in the CR or instability in the Average CPT. The way in which CPT, CPA and CR relate is particularly important to keep in mind when calculating CPT Bids for keywords and Default CPT Bids for Ad Groups.
The series of graphs, below, show real fluctuations in Average CPAs that we have observed in campaigns we have optimised. By plotting the data series for both the Daily Average CPT and the Daily Average CPA, against time and price, you can quickly see whether fluctuations in Average CPAs are due to deviations in the Average CPT or the CR. Once you know what is producing the fluctuation in CPA, you can optimise your campaign appropriately.
Case Study 1: Stable Brand CR but varying Market Competitiveness
We have observed that although the CR may remain stable over time, the price you pay for a tap (even if it is for your app’s name!) can vary. The price you pay for a tap is, in part, determined by the competitiveness of the market. For example, if no one else is bidding for your search term, you may pay a couple of pence for a tap but when a relevant competitor starts bidding on your brand, you may see an increase in the Average CPT. The graph, below, shows the CPA fluctuations that can be observed when protecting your brand. The spike in CPT is likely to be a result of relevant competitors bidding on your brand, making the cost of protecting your brand more expensive.
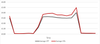
Figure 1. A Graph to show how the Average CPA of a Brand Protection Ad Group can fluctuate despite having a relatively stable CR.
Case Study 2: Stable Competitor Average CPT but an oscillating CR
Conversely, we have seen that while the Average CPT can remain relatively stable over time, the daily CR can vary significantly (see Figure 2.). In this scenario, the increases and decreases in the Average CPA are not a result of the competitiveness of the market place, but can be attributed to the ‘messiness of human behaviour’ (sometimes will tap and download, sometimes will tap and not download). Before optimising CPT Bids or pausing keywords, you should analyse the demographic breakdown of the Ad Group, to see if one age group is ‘messier’ than the others; look for significant differences in the Average CPAs, and if these differences are found, the demographics targeted should be adjusted accordingly.
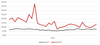
Figure 2. A Graph to show how the Average CPA of a Competitor Ad Group can fluctuate with a relatively stable Daily Average CPT but varying CR.
Average CPA fluctuations observed at the Ad Group level can also be seen at the keyword level (see Figure 3.). The graph, below, shows CPA fluctuations of the keyword in the same Ad Group as Figure 2. By plotting both keyword and Ad Group data, you can quickly analyse trends to see if fluctuations are due to irrelevant keywords in the Ad Group or ‘human messiness’.
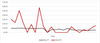
Figure 3. A Graph that shows that the same fluctuation observed at the Ad Group level can be seen at the keyword level. Please note that the drops to £0.00 reflect either no taps or no conversions that day.
The answer lies at the Keyword level
To reduce the Average CPA of a campaign or Ad Group, keywords need to be optimised; higher CPA keywords should either be paused or have the CPT Bid lowered. Pausing high CPA keywords can be the quick and easy way to reduce the Average CPA but it can lead to a significant drop in traffic. When the high CPA keyword does not produce a high volume of traffic, pausing the keyword is an appropriate action.
Conversely, if the high CPA keyword generates a large volume of Impressions and Downloads, then pausing the keyword will, unmistakably, lead to a dramatic loss of traffic. Instead, the first step should be incrementally reducing the CPT Bid. Since the Average CPT is an average, you should still receive some traffic, albeit reduced, by decreasing the CPT Bid, which should slightly lower than the Average CPT, and in turn also lower the Average CPA.
Data, data and more data
When it comes to optimising an Apple Search Ads campaign, take a data-driven approach; the more data, the better! The greater the volume of data, the more reliable the trends are and the better the decisions you will make. Daily Average CPAs can fluctuate significantly, especially in certain app genres; therefore, making changes based on one day’s set of data can be quite a risky strategy, which can lead to conservative bids and a significant loss of traffic.
There are no hard-and-fast rules regarding the time range you should set the campaign; time is not the important metric, data volume is. Take both a ‘global’ and a ‘local’ perspective when analysing CPAs; a wide time range will give you more reliable trends whereas recent campaign data will give insight to recent changes in the market.
Redbox Mobile CPAs Optimisation Top Tips:
1. The more data, the better!
The greater the volume of data, the more reliable the averages and trends are; and the better the decisions you will make.
2. Take both a ‘local’ and ‘global’ perspective
When analysing the Average CPAs, look at the CR and the Average CPT over both a recent and longer time range. Taking a ‘local’ perspective will notify you of recent changes in the market and current relevancy of keywords; whereas, taking a ‘global’ perspective will inform of the variations that are reliable trends and those that are just expected fluctuations.
3. If both the Conversion volume and CR of a keyword are low, pause the keyword!
When a low CR is coupled with a low Conversion volume, pause the keyword. The volume of traffic and downloads lost will be minimal and the campaign budget is better spent elsewhere.
4. If the Average CPT and Conversion volume is high, lower the CPT Bid!
The Average CPT is an average; in other words, sometimes you will pay slightly higher, and sometimes lower, than your Average CPT for a tap. By incrementally decreasing the CPT Bid for that keyword, your target KPI can be achieved by finding the right balance between Conversion volume and CPA.
Still want to know more about CPA fluctuations and optimisation? Get in touch with Redbox Mobile to find out how and when to react to High CPAs in Apple Search Ads.