What data, Where?
The Apple Search Ads dashboard is where you can optimise your Cost Per Tap (CPT) Bids, edit your keywords and see all of the data associated with your ads, right up to the user hitting the download button. But that's where it stops. If you want to know what your new customers are doing post install, you'll need a Mobile Measurement Partner (MMP) - for example, Adjust or AppsFlyer - integrated. This, unsurprisingly, often leads to your performance data being collected and stored in two different places. To work out how your campaign is performing, you'll need to combine multiple CSV exports into endless Pivot Tables and VLOOKUPs in Excel – not the best way to spend an afternoon.
To automate this process, we've redesigned our Events Tab so you can easily see trends between our platform-optimised Apple Search Ads data and the post-install data, which events are your top events, and what users typically do after they hit the download button. Bye, bye Pivot Tables! In addition to our Region and Date filters, we have added a brand spanking new filter exclusive to the Events Tab. The new filter allows you to dynamically organise your events by Tap Time, Download Time or Event Time.
Time is Money…
Each post-install event that your MMP attributes back to Apple Search Ads has an associated Tap Time, Download Time and Event Time. Tap Time is the time at which the user who completed the event tapped on your Apple Search Ads ad, while Download Time refers to when the user first opened the app and Event Time is when the event in question was triggered by the user.
You may have noticed that the definition of a download used for Download Time is that of the MMP's rather than Apple's, which means that the Tap Time is the only common time between Apple and your MMP. In addition to this, Apple doesn't charge you when a user opens your app or completes an event but when the user taps on your Apple Search Ads ad. So, Tap Time is the best time to use to match up your MMP data with Apple Search Ads to review costs and answer questions such as, does spending more in Apple Search Ads lead to more purchases? This doesn't mean that you should ignore the other two times though, filtering by Download Time or Event Time can shed light on whether marketing, such as a new promotional offer, led to existing downloaders of your app launching the app or those who have already engaged with the app to complete the promotional event.

Is there a Relationship between what I Spend and the Number of Events Generated?
We've already briefly touched on how the Apple Search Ads dashboard is where you make Bid adjustments and edit keywords but that you need both the Apple Search Ads data and the MMP data to judge the campaign's performance. After all, it is by combining these two data sets that you can determine whether changes made in the Apple Search Ads dashboard are associated with changes in the post-install performance. For example, I may have increased my Apple Search Ads budget recently and I would like to see whether this increase in spend is associated with the generation of more purchases – if it isn't, I might struggle to fund future spend. Because I know that Apple charges me per tap, I can set my filter to Tap Time to review this relationship. I can further filter this graph by Regions to see if it's a trend across all the Storefronts that I'm advertising in.
Not only am I saving time by the data being displayed in one place, I'm one Tab away from changing my Monthly Budget, editing my Cost Per Download Goals or adding Budget in response to what I see. So, if I see a positive relationship between spend and my KPI event, I can add more budget or increase my CPD goals with the hope of achieving more events. Equally, I can go to the Keywords Tab to see which are my top performing keywords and add these to my Boosted list in the Targeting Tab.

Safety in Numbers.
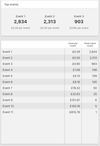
Displaying the data visually can be helpful when you're looking for trends but sometimes, you just want to know the numbers, the exact number of events generated and how much each event has cost you. To view the Cost Per Event values, select the Tap Time filter, which takes all the Apple Search Ads spend for your selected date range and divides this by the total number of events that have been generated from users who tapped on the ad in the date range. For example, if I spent £100 in Apple Search Ads yesterday and all the users that tapped on my ad then have been busily making purchases yesterday and today that totals up to 50, my Cost Per Purchase would be £2.

Since we can't match up the Apple Search Ads Spend to events using their Download Times or Event Times, when you have these filters selected, we show the average number of times a unique user completes that event, in your chosen date range. For example, if you had 50 unique users that purchased 150 'additional coins', then the Events Per User would be 3.
What does my User Journey Look Like?
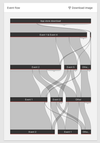
Are you interested in knowing what your Apple Search Ads customers do after they open your app? And, in what order? If you are, you'll like our Events flow diagram. It starts with the number of downloads recorded by Apple Search Ads and moves through the next four distinct events your users complete. You may notice that some of your events have the word 'multiple' next to them; this just simply means that those users completed that event multiple times before moving onto the next different event.

Apart from being just simply interesting, understanding which events precede others can be especially useful when you want to optimise your Apple Search Ads campaign to an event that doesn't happen frequently. You can find a 'proxy event' that happens more frequently and is predictive of your users completing the desired event and then optimise to this. For example, you may want to optimise your campaign to purchases; after all, that's what helps pay for the advertising. Perhaps not many of your users make a purchase but a few more register and those who register in your app are likely to make a purchase. In this example, your registration event would make a good proxy event for you. Similarly, if your app offers a 30-day free trial, you are likely to have a delay of at least 30 days between users downloading the app and converting to the subscription, so your free trial event would be another good example of a proxy event.
Together Forever
Your Apple Search Ads data belongs with your MMP data; you can't truly appreciate the performance of your campaigns without matching up the two data sets. To calculate the costs and ROAS, you need to match MMP data and Apple Search Ads data using the MMP's Tap Time. And, when optimising your campaign to ROAS targets or to maximise generation of a KPI event, review the typical User Journey. This is particularly useful when your revenue generating event doesn't occur frequently enough or can be delayed by free trials; use the Event Flow to find the event that is a good predictor of the money-maker.
Log in or Get Started on the Redbox Platform to see our new Events Tab in action and to stop wasting time generating those Pivot Tables and VLOOKUPs.