
Why the Rebranding?
Well, firstly, we didn’t like the connotations that a ‘Blackbox’ isn’t very transparent. Since the launch of the Blackbox Platform in 2018, we have had this feedback, regularly. We felt that we were doing our platform a disservice as it is anything but ‘not transparent’. The dashboard provides an interactive display of the data and is supported by CSV reports that contain the raw data.
Additionally, we wanted to connect our agency business, Redbox Mobile PLC, with the platform; after all, it is the expertise gained from when we ran Apple Search Ads campaigns manually that has influenced our algorithms and data visualisations. We were able to take the types of reports our clients were requesting and display the data in a format that is easy to view.
A Lick of Red Paint
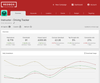
How could we truly become the Redbox Platform if we kept the Blackbox colours? With the colour refresh, we have also updated the design of the campaign view; the filters have been moved out of the header and onto the tab. Although it has moved, your last filter selection will continue to be remembered and the selected filter will still apply to all the reporting tabs. We have also grouped the data that goes hand-in-hand with each other into cards so that you can effortlessly see how well the campaign is performing.
Not Just a ‘Lick of Red Paint’?
In addition to the design refresh, we have updated some of the current of functionality (with plans for more updates!). Our first step was to review how we were sending the data to our dashboard. We have improved our internal APIs so that data is sent and displayed quicker, meaning you will be able to see your campaign’s performance in no time at all.
We have also updated how you get the CSV reports. Previously, these reports were sent to the email address you were logged in with, which meant that you had to have access to your inbox while you were reviewing your campaigns. Now, when you hit one of the CSV report buttons on the Overview tab, the report is downloaded straight from your browser. The time and storefront filters still apply to the reports allowing for extra precision if wanted.
Finally, we have added Percentage Change Comparisons on the Overview tab so you can quickly see how your campaign is performing over time. Unsurprisingly, green indicates good changes and red, not-so-good changes. So, percentage decreases in Cost Per Download will show in green while percentage decreases in Impressions will show in red. The comparison values for the Tap through rate and Conversion rate metrics show percentage point changes rather than the relative percentage change to allow for a more meaningful comparison.
So, farewell Blackbox!
Check out the brand-spanking new Redbox Platform by logging into your account or if you're new to the platform, by requesting a demo.