Apple Search Ads is not only an effective way to promote your app in the iOS App Store but also a tool that gives direct insight into the searches that lead users to download your app. Sometimes, there is one clear winner when it comes to which keyword is the most efficient at driving downloads but more often than not, your top keyword changes from day to day. Why? Because searches are often reflective of what's going on outside of the App Store, which we know isn't static!
The Highs and Lows of the Top 5
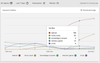
Your five best performing keywords are displayed in a line chart for a clear communication of how these keywords have performed over the time range you have selected. The best is defined by the keyword metric you choose to filter the page by; if you have event tracking enabled, you can filter by your post-install events as well as Apple Search Ads metrics. Reviewing the keyword performance daily is usually most helpful when trying to understand any fluctuations you may have seen in your overall count of the selected metric. It can help you to define when a spike occurred and whether it was a general increase or the result of one keyword. Both the Keyword timeline chart and the Keyword cloud can be downloaded straight from your browser as a PNG to add to reports.
Snapshot of Keyword Performance Captured in the Cloud
The Keyword cloud is where you can see how your keywords are performing relative to each other. The bigger the keyword, the better it is performing with your best performing keyword highlighted in red. So, for example, if you have selected Cost per download as your keyword metric to filter the page by, the keyword with the cheapest Cost per download will be the biggest and highlighted in red. Clicking on the keyword shows its performance summary and the flags of the contributing regions. And clicking the stopwatch icon in the Keyword cloud card allows you to transition between Keyword Clouds within your time range
Moving On Up
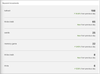
Your top keywords may not have always been at the top for your campaign. The Keyword movements card details the top six keywords for your page filters and summarises the change in performance seen in your selected date range from the previous equivalent timeframe. Just like the Keyword cloud, by clicking on the keyword, you can see its performance summary and which regions contributed to the performance metrics.
Show me the Numbers!
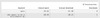
Not a fan of graphs? If you prefer reviewing the raw numbers to assess performance, scroll straight down to the keyword table. Ordered by the keyword metric filter, see the costs and downloads generated by your top keywords. To see all the performance metrics for the keywords in the campaign, simply export the Keyword CSV report by clicking 'Download data' (you can also download this report from the Overview tab). Like the visualisations, the data in the table and the reports are filtered by the regions and date range selected in the page filters.
Your Apple Search Ads keyword data is not just an 'oh that's interesting to know'; use it to boost your organic rankings by incorporating your top keywords in your App Store Optimisation (ASO) strategy. An effective ASO strategy involves questioning whether the keywords in your metadata are still relevant and best represent your app, which is exactly what the Apple Search Ads data can tell you.